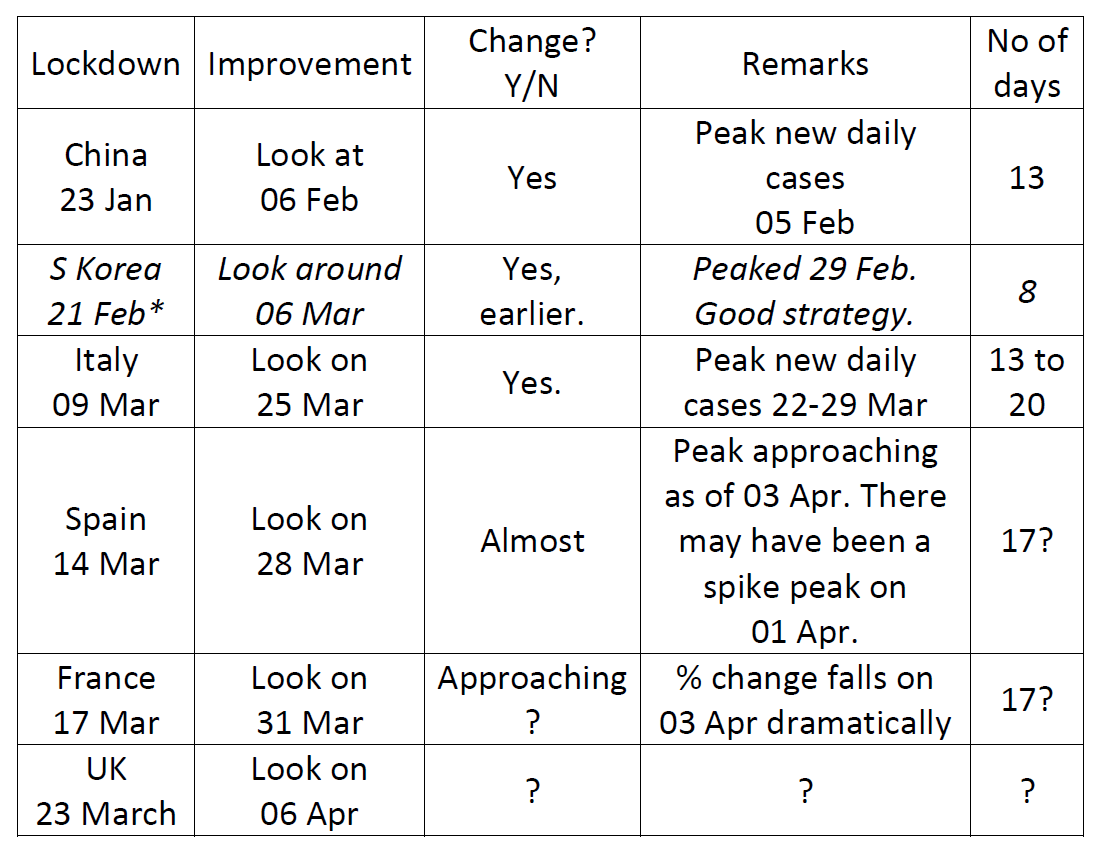
2020-03-11 COVID-19 Italy improves a lot due to one new, significantly lower point. S Korea and China steady.
Hi folks!
Here are the revised forecasts with data from WHO situation report #51 on 11 March 2020 for the current cumulative coronavirus case numbers:
China cumulative cases: 81,386 by end of April (change <1/day by 5th April).
Down slightly from 81,386 yesterday
China cumulative deaths: 3,374 by mid-May (change <1/day by 15th April).
Down slightly from 3,395 yesterday. Every one counts!
South Korea cumulative cases: 9,164 by early May (change <1/day by 12th April).
Up slightly from 9,083 due to new point below the trendline.
Here are the revised forecasts with data from WHO situation report #51 on 11 March 2020 for the current cumulative coronavirus case numbers:
China cumulative cases: 81,386 by end of April (change <1/day by 5th April).
Down slightly from 81,386 yesterday
Down slightly from 3,395 yesterday. Every one counts!
South Korea cumulative cases: 9,164 by early May (change <1/day by 12th April).
Up slightly from 9,083 due to new point below the trendline.
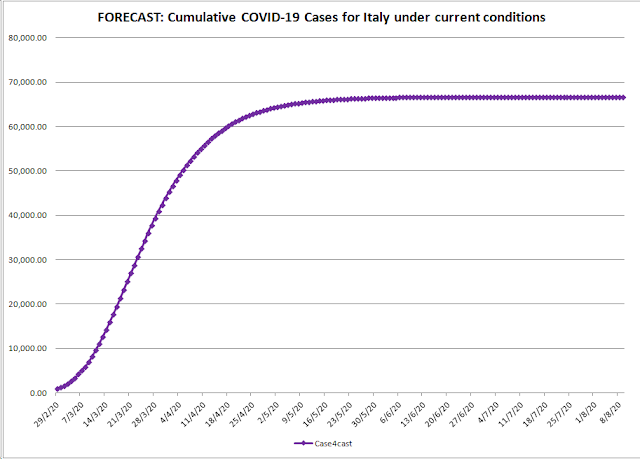
Italy cumulative cases: 66,700 by mid-August (change <1/day by 30 June)
Up from 51,332 three days ago but thankfully down a lot from 118,379 and 82,000 one and two days ago. This forecast is extremely tentative and volatile but was improved a lot by a % day over day change of 10%, well below several recent 20% points.
Italy graphs:
Forecast:
Trendline:
It is good now to see the last two points straddling the trend line. Let us hope that there will be more days of improvement like this and that it is not just a day when the laboratories produce fewer test results due to some delay.
This trend is beginnnig to look potentially realistic. Let us hope and pray than he quarantine measures will drag the line down further.
This is the equation that is giving 66,700 cases as the potential end point.


Comments
Post a Comment