Posts

Showing posts from March, 2020

Italy's extremely hard won success in controlling the epidemic

Image
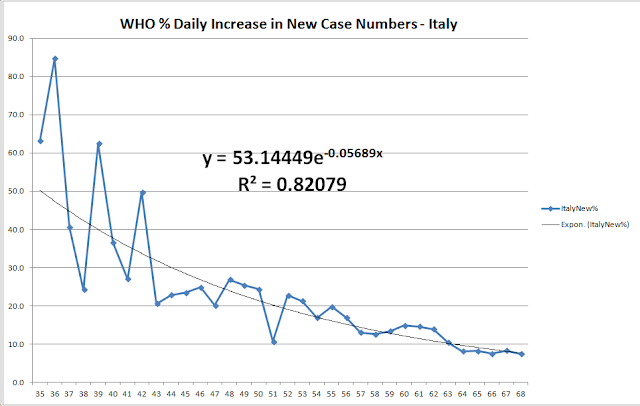
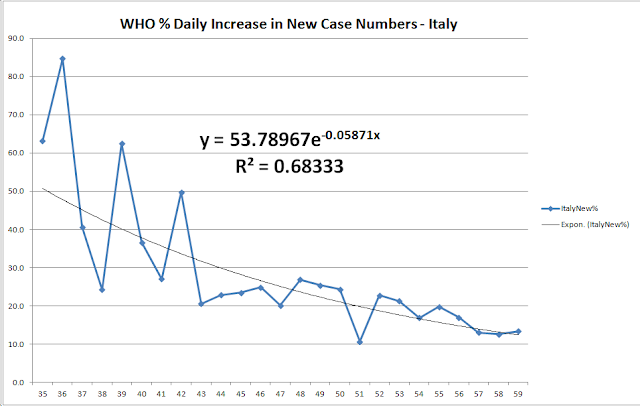
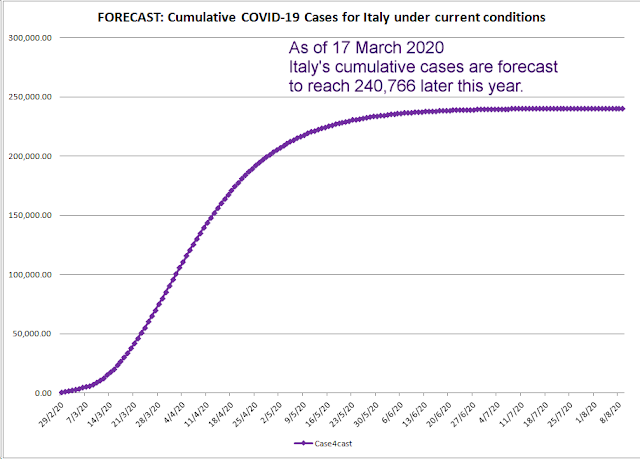
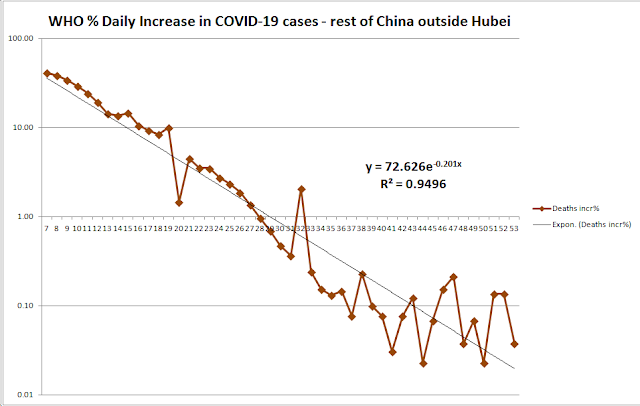
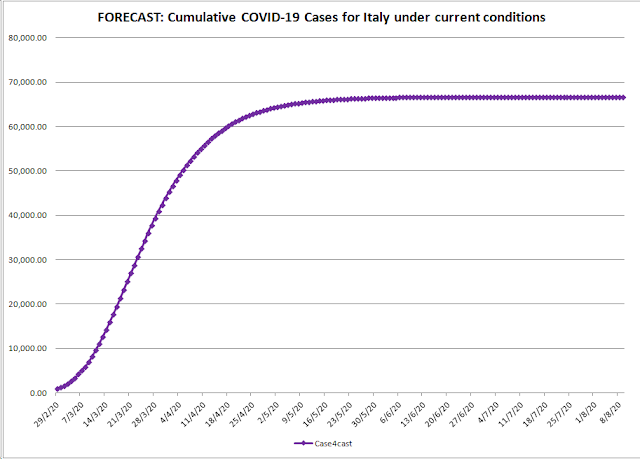
I must salute Italy for their extremely hard won success in controlling the epidemic as of WHO reporting day 68 (28 March 2020) I now share my forecasts over the past several days for the end of the Italy epidemic. They are coming together around 325,000 cases: 324001 mar28th 328190 mar27th 326803 mar26th 345729 mar25th 364957 mar24th 335034 mar24th 382533 mar23rd 395385 mar22nd 343188 mar21st 292436 mar20th 248891 mar19th 234607 mar18th 318868 mar17th Here is the trendline of their % daily rate of change: Forecast curve with R0 values implied: The deaths trend gives a final toll of 42,672: case fatality for confirmed cases of 13.17%: Peak new daily cases comes down a bit to 6,685 on 02 April (soon, hopefully!) and peak deaths at 938 on 5th and 6th April:

Relative performance of different countries under COVID-19

Image
This chart indicates the relative performance of different countries under COVID-19. It shows that rate of percentage daily change in cumulative case numbers versus the actual number of cases. It really illustrates the potential trajectories of the epidemics in the different nations under this pandemic. Note the red box at 40,000 cases. The daily % increase for Spain > Italy > China. Back at 25,000 cases, Spain and Italy were both overtaking or about to overtake China's daily % increase and the rates were not falling as fast as they did in China. This was a key indictor that Italy and soon Apin exceed China. Italy already has, sadly, in terms of deaths and is right at the point of overtaking China in terms of cases and heading to the hubndreds of thousands. Spain is likely to have a similar fate, probably worse than Italy. France at 25,000 cases has a % rate of increase that is approaching China's. Again, the rate of increase daily in France is not falling at the

Forecasting totals for the world outside of China #2 : 2 billion+

Image
I have been observing the cumulative COVID-19 case numbers outside of China for some time.  I made the following subsequent forecasts, taking the data from day 38  (27 Feb, the start of the trend)  on these recent dates: WHO report day        Date               Forecast 57                           17 Mar            26,262,767 58                         18 Mar              14,370,854 59                           19 Mar             29,564,555 60                           20 Mar             48,128,079 61                           21 Mar            610,371,636 62                           22 Mar            459,750,615 63                           23 Mar         2,264,576,823 64                         24 Mar        3,327,687,411 65                         25 Mar        3,025,468,499 66                         26 Mar         2,782,982,131 Days 63 to 66 seem to be fairly stable in the forecast at around 2-3 billion! BOTTOM LINE: There needs to be a steepening of the downtre

Forecasting for world totals from figures outside of China.

Image
I have been observing the cumulative COVID-19 case numbers outside of China for some time. Today, they passed 250,000.  For some days, I've been looking for an opportunity to try to forecast the world total at the end of the pandemic.  To do this, I needed to exclude China figures since the epidemic in China is a separate system and skewed the data. The timing of the China epidemic was obviously at least a couple of months before the breakout in the rest of the world. Cause and effect. As with all my other forecasts, I am looking for a slowdown in the exponential trend of world cases. The daily % rate of change (or the scale factor) has to decrease over time for the epidemic to be limited at all. I  have seen signs that the &% increase has been slowing, though only slightly. This has occurred over the past  25 days: The first serious attempt was made on day 52 and 53 (12 and 13 March) and that gave a forecast totals of 26.3 million and 14.4 million total cases res

Coronavirus COVID-19. The pain goes on for Italy. UK may catch up with Italy on 4 April.

Image
My forecasts for Italy the past few days deteriorated form the 230,000-250,000 level up to the 300,000-400,00 level due to a three above trend data points in the last three days. Italy forecasts for end of epidemic cumulative COVID-19 cases, using data up to date given (latest first): 395,385  mar 22nd 343,188 mar 21st 264,538  mar 20t h 248,891 mar 19th 234,607 mar 18th 240,766 mar 17th Peak daily new cases is forecast to be 7,620 on 5th April 2020 . First very tentative estimate for total Italy deaths made on 21 March was 48,050 , a 14% case fatality ratio from the (likely largely underestimated due to non-testing of mild cases) total cumulative case numbers. This matches with the current fraction of  (severe cases + deaths) / cumulative cases x 100 ... as quoted currently by Worldometer. WHO does not give "severe" or "critical" case numbers. Secondly, it is possible that the UK will catch up with Italy by 4th April if the current

Italy forecasts fairly consistent at 200,000-250,000 cases for last 3 days.

Image
My forecasts for the past three days have all given total final case numbers for Italy as coming to around 200,000-250,000 cases. In additon, two earlier forecasts gave around 210,000 and 255,000. Italy forecasts for end of epidemic cumulative COVID-19 cases, using data up to date given (latest first): 248,891 March 19th 234,607 M arch 18th 240,766 M arch 17th The trend of decreasing percentage daily changes seems to be forming: Unfortunately, the trend still predicts there is a long way to go. Italy is at 35,713 cases as of WHO report 59 (19 March 2020). The forecast at the moment is for a halt at 248,891 (purple line): The forecast also gives the peak of the new cases per day at 5293 on 1st April 2020: This log scale graph compares Italy with Spain, Germany, France and the UK. Note that the Italy line is becoming shallower again, making the forecasting possible. Compare this with the first chart above with the decreasing % daily increases in cases. It can be s

COVID-19 Forecasts based on data up to WHO report #57

Image
Forecasts based on data up to WHO report #57: Italy  cumulative cases: approx. 240,000 (settling in range 200,000-255,000?) South Korea  cumulative cases: down to 8,347 China  cumulative cases: down to 81,253 China  cumulative deaths: down to 3,347 Globally: very high uncertainty but current trend points to around 26 million. Here's a really good video on how to handle family life hold up at home for a few weeks or months: https://www.youtube.com/watch?v=aRR2ot8CuM4&t=8m30s With Dr. Chris Martenson and  Dr. Peter Boghossian, best-selling author of the book 'How To Have Impossible Conversations'. Italy's curves: Construction of daily new cases, together with current cases if illness lasts 10 and 14 days: Contrast S Korea's actual curve from a few days ago - forecast actually now under 9,000: Forecast curve - the flattening portion is in play now:

Possible 55,000 COVID-19 cases now in the UK says Chief medical Officer

Possible 55,000 COVID-19 cases now in the UK says ChiefScientific Adviser Sir Patrick Vallance: https://www.aol.co.uk/news/2020/03/17/around-55-000-people-have-coronavirus-across-uk-says-chief-scie/ This may be based on the idea that 1 in 1000 people die and 55 people have died so far. The offical current confirmed case count in the UK according John Hopkins University dashboard is 1,960. https://gisanddata.maps.arcgis.com/apps/opsdashboard/index.html#/bda7594740fd40299423467b48e9ecf6 Rememer that, because the government no longer will test mild cases that do not go to hospital, the actual number of cases is bound to be much higher than the confirmed number given online from now on, in any case. I don't know whether this 1 in 1,000 or 0.1% death rate is accurate. It's difficult becau se it may be evident that death rates of confirmed cases are much higher (1-7%) in various countries but if you compare this with the 2009 H1N1 swine flu epidemic, the case fatality rat

Another bad day for Italy. Forecast has risen from 153054 to 219913. Also RoW nearly = China

Image
Rest of world outside China now has 72,469 confirmed cases (up 10,955) versus China at 81,048 cases (up 27). Tomorrow, the rest of the world will almost certainly overtake China. My original forecast was that if the exponential trend continued, it would do that today. So I was one day early... https://covid19stats.blogspot.com/2020/03/rest-of-world-might-catch-up-with-china.html Forecasts based on data up to WHO report #55: Italy cumulative cases: up to 219913 from 153084 South Korea cumulative cases: down to 8360 from 8419 China cumulative cases: down to 81299 from 82253 China cumulative deaths: down to 3274 from 3374 Oh dear - another bad day for Italy. Forecast has risen from 153054 to 219913 cumulative cases at end of epidemic from 150,000 approx on each of the two days before. As you add another data point, the forecast line and equation moves a little and it can make quite a large change to the outcome. As more points are added over time, this volatility should d

There are questions about whether the pandemic is controllable without gargantuan efforts.

Image
First here is a link to charts and videos on my YouTube channel: https://www.youtube.com/channel/UCbp8PaGqRKC6EoH4lAviFOg Today I think I found a indication in the data that basically shows the difficulty in managing the spread of this viral disease, which has so far been slowed down in some key locations (Wuhan it, Hubei Province, China, South Korea) by putting very strict social distancing and other measures in place. This is connected with the figures in the quarantined major more mildly hit cities in China compared to countries like Singapore that have done very well but are showing signs of breaking out. Post epidemic (Rest of China) and pre-epidemic features (Singapore) are similar. This needs more work but residual clusters seem to persist and could perhaps seed new epidemics wherever strict quarantines are lifted. If so, this could change the economic backdrop and lifestyle of the world until a vaccine or drug treatment is found.  That doesn't mean we should give up f

UK under 4 weeks behind Italy (maybe 15 days) on similar exponential trend, slightly slower. Spain France and Germany 10 days behind.

Image
UK 4 weeks or less behind Italy on similar exponential trend, slightly slower. Spain France and Germany 2 weeks behind Italy , well, 10 days. I actually think UK is 15 DAYS behind Italy. Jeremy Hunt says there are likely 10,000+ cases in UK already. https://www.youtube.com/watch?v=3rmMh2pLKAc The equations are for France and Germany - nearly the same. All are in exponential trends with Italy slowing slightly, perhaps. Maybe that is because of stringent quarantinges of some areas, then the whole country. As with China, cases are likely to increase a lot before they slow, maybe another 10 fold to  100,000. See last graph for that. South Korea on an S-curve - epidemic nearly over, unless it comes around again, which it will, unless they seal off their country to outside visitors for the rest of 2020:

2020-03-11 COVID-19 Italy improves a lot due to one new, significantly lower point. S Korea and China steady.

Image
Hi folks! Here are the revised forecasts with data from WHO situation report #51 on 11 March 2020 for the current cumulative coronavirus case numbers: China  cumulative cases: 81,386  by end of April   (change <1/day by 5th April). Down slightly from  81,386 yesterday China  cumulative deaths: 3,374 by mid-May   (change <1/day by 15th April). Down slightly from  3,395  yesterday. Every one counts! South Korea  cumulative cases: 9,164 by early May  (change <1/day by 12th April). Up slightly from 9,083 due to new point below the trendline. Italy  cumulative cases: 66,700 by mid-August  (change <1/day by 30 June) Up from 51,332 three days ago but thankfully down a lot from  118,379  and 82,000 one and two days ago. This forecast is extremely tentative and volatile but was improved a lot by a % day over day change of 10%, well below several recent 20% points. Italy graphs: Forecast: Trendline: It is good now to see the last two points straddling the

COVID-19. Very tentative rest of world forecast hint at minimum 600,000 to 1,000,000 documented cases.

Image
I have attempted to find a trend in the world data outside China. These are highly uncertain but a couple of very weakly declining trends are showing on two charts. These are extremely approximate and I would say that these are bare minimum forecasts, especially given the obvious understatement of case numbers and testing delays in some countries - but we have to go with whatever data we have however imperfect or lagging. Here, the daily % day over day change against time. First, the forecast of 617758 cases and then the treeline that gives it, which is very tentative right now: Here, the new graph showing the % daily change against the number of cases at the time. Versus the caseload, the decline in rest of world cases (purple) is much, much slower than that of China (yellow) at the same point (20000-30000 cases). The China line converges on 80000-90000 as is clearly seen bit the rest of world like would go out to around 1,000,000 (one million) cases.

Updated forecasts on COVID-19 Coronavirus: WHO situation report #50 data. Italy much worse, S Korea better.

Image
Hi there. On Sunday I re-ran the forecasts for China, South Korea and Italy using the latest figures from WHO Report #49. Well now I updated them again on Tuesday fro m report #50. Here are the results for the potential end of various epidemics, subject to current conditions. There is a huge change for the worse in Italy, one more point above the line has doubled the forecast. China  cumulative cases: 81,386  by end of April   (change <1/day by mid-April?) Down slightly. China  cumulative deaths: 3,395 by mid-May   (change <1/day by mid-April?) Same as previous forecast. South Korea  cumulative cases: 9,083 by 5 May  (change <1/day by mid-April?) Down from 9,938 due to new point below the trendline. Italy  cumulative cases: 118,379 (!!) by 31 July  (change <1/day by 28 June) Up from 51,332 two days ago and  82,000 one day ago. Italy 's forecast overtook that of China on Monday night. This shows the potential of the disease. Italy is Wuhan 2.0. 1. China

COVID-19 Coronavirus: Disastrous new forecast for Italy, 50k+. S Korea steady. China good.

Image
Hi there. On Sunday I re-ran the forecasts for China, South Korea and Italy using the latest figures from WHO Report #49. Here are the results for the potential end of various epidemics, subject to current conditions: China cumulative cases: 81,466  by end of April   (change <1/day by mid-April?) China cumulative deaths: 3,395 by mid-May   (change <1/day by mid-April?) South Korea cumulative cases: 9,938 by 5 May  (change <1/day by mid-April?) Italy cumulative cases: 51,332 (!!) by 31 July  (change <1/day by 28 June) 1. China The China result surprised me because the daily rate of change has lowered the forecast considerably, implying fewer than about 1,000 more new cases. I find that a little difficult to believe but the maths says so. Of course, there is always the possibility of minor outbreaks that will make the epidemic linger for longer in China but the numbers are converging fast. 2 South Korea The South Korea forecast has improved due to a c