Forecasting for world totals from figures outside of China.
I have been observing the cumulative COVID-19 case numbers outside of China for some time. Today, they passed 250,000.
For some days, I've been looking for an opportunity to try to forecast the world total at the end of the pandemic.
To do this, I needed to exclude China figures since the epidemic in China is a separate system and skewed the data. The timing of the China epidemic was obviously at least a couple of months before the breakout in the rest of the world. Cause and effect.
As with all my other forecasts, I am looking for a slowdown in the exponential trend of world cases. The daily % rate of change (or the scale factor) has to decrease over time for the epidemic to be limited at all. I have seen signs that the &% increase has been slowing, though only slightly. This has occurred over the past 25 days:
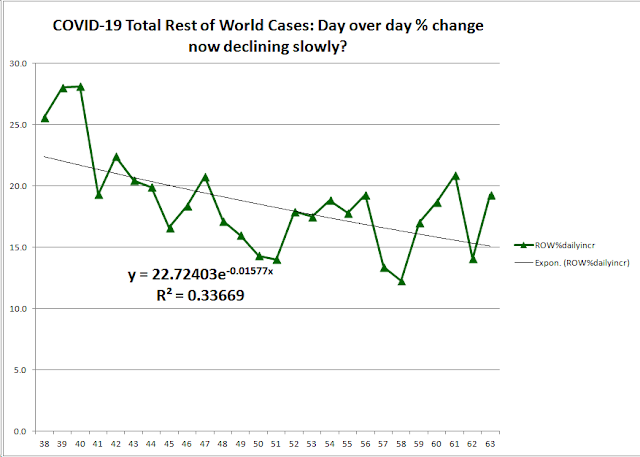
The first serious attempt was made on day 52 and 53 (12 and 13 March) and that gave a forecast totals of 26.3 million and 14.4 million total cases respectively. This seemed reasonable to me. Note that days 52 & 53 are a step up from the four previous points. An attempt around Day 51 (11 March) gave figures in the 2 million range but it is now clear that the trend line established a higher trajectory since then, which has been maintained. Even a slight decrease in the downward slope can give a very large increase in the forecast total. There is still a lot of volatility and the correlation coefficient R2 is poor at 0.4 but this is the data, so that's all I have!
Anyway, I made the following subsequent forecasts, taking the data from day 38 (27 Feb, the start of the trend) on these recent dates:
WHO report day Date Forecast
57 17 Mar 26,262,767
58 18 Mar 14,370,854
59 19 Mar 29,564,555
60 20 Mar 48,128,079
61 21 Mar 610,371,636
62 22 Mar 459,750,615
63 23 Mar 2,264,576,823
Day 63 was another bad day. As you can see, there is potential for virtually the entire world population to become infected, just based on declared confirmed cases, which are almost always an understatement of the actual numbers.
BOTTOM LINE:
There needs to be a steepening of the downtrend in the day over day percentage change in order to stop this from being a worldwide infection. These methods were reliable for analysis of the trends in China and S Korea and are starting to show some consistency for Italy's epidemic, all treated as separate systems, so there is no reason why this method should not provide a good forewarning of the potential for the world as a whole, especially since the pandemic was seeded from China to the rest of the world at around the same time.

Comments
Post a Comment