There are questions about whether the pandemic is controllable without gargantuan efforts.
First here is a link to charts and videos on my YouTube channel: https://www.youtube.com/channel/UCbp8PaGqRKC6EoH4lAviFOg
Today I think I found a indication in the data that basically shows the difficulty in managing the spread of this viral disease, which has so far been slowed down in some key locations (Wuhan it, Hubei Province, China, South Korea) by putting very strict social distancing and other measures in place. This is connected with the figures in the quarantined major more mildly hit cities in China compared to countries like Singapore that have done very well but are showing signs of breaking out.
Post epidemic (Rest of China) and pre-epidemic features (Singapore) are similar. This needs more work but residual clusters seem to persist and could perhaps seed new epidemics wherever strict quarantines are lifted. If so, this could change the economic backdrop and lifestyle of the world until a vaccine or drug treatment is found.
That doesn't mean we should give up fighting the disease but it means that the possibility of eliminating it is low until a treatment or vaccine is found. While there is any one country that allows cases to skyrocket, the rest of the world could potentially be get infected or re-infected. In fact, even with everyone trying, new outbreaks could perhaps be seeded again, starting with any small cluster(s) still in existence. This disease is evidently highly infectious and the viral shedding whilst asymptomatic or with mild symptoms (as described by UK Chief Medical Officer on 13 March) is probably a major cause of this problem.
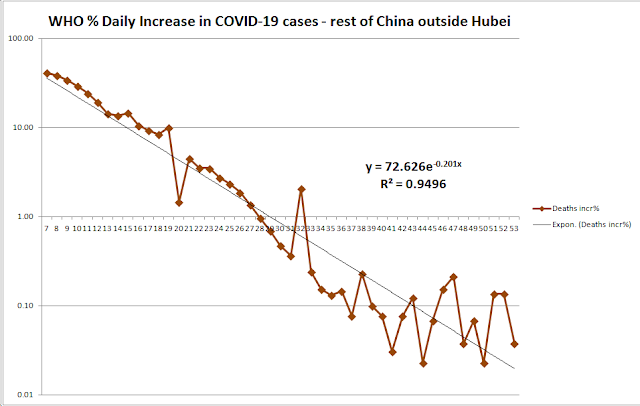
See how the next two charts level out:
China outside of Hubei - they have probably done best in stopping the epidemic so far - but persistent rate of change in cases exists around +0.1%, even with fairly strict limits to social interaction:
China outside of Hubei - very similar plot, this time of actual new daily cases, stuck between single figures and about 25/day, averaging 10 or so:
When South Korea reaches my forecast end of its current epidemic at probably below 9,000 cases (see elsewhere, a fantastic achievement, I think), I expect the above feature might appear there as well.
Compare the above two to Singapore below ("pre-epidemic"). Singapore is a poster child for success so far - but it is starting to break away into a mild acceleration. Note how similar the clusters are to the two charts above. Here is Singapore new daily case. Note small initial clusters of increasing size, then a lull, then new clusters that are slightly larger (only small right now but persistent at around 10 new cases/day):

This is enough to cause some acceleration in Singapore chart and a vaguely parabolic trend, far slower than the exponential trend seen in many other countries:

Also, the % day over day change in Singapore is increasing slightly after a lull. The left hand spike at +75% can be ignored and was caused by the cases going from 4 up to 7. Remember those single digits? Note that spike on the right up to a point at 10%/day. Signs of a small breakout or at least of persistent case clusters at around 10 new cases per day on a total approaching 200 i.e. 5%/day on average for last few days:

Today I think I found a indication in the data that basically shows the difficulty in managing the spread of this viral disease, which has so far been slowed down in some key locations (Wuhan it, Hubei Province, China, South Korea) by putting very strict social distancing and other measures in place. This is connected with the figures in the quarantined major more mildly hit cities in China compared to countries like Singapore that have done very well but are showing signs of breaking out.
Post epidemic (Rest of China) and pre-epidemic features (Singapore) are similar. This needs more work but residual clusters seem to persist and could perhaps seed new epidemics wherever strict quarantines are lifted. If so, this could change the economic backdrop and lifestyle of the world until a vaccine or drug treatment is found.
That doesn't mean we should give up fighting the disease but it means that the possibility of eliminating it is low until a treatment or vaccine is found. While there is any one country that allows cases to skyrocket, the rest of the world could potentially be get infected or re-infected. In fact, even with everyone trying, new outbreaks could perhaps be seeded again, starting with any small cluster(s) still in existence. This disease is evidently highly infectious and the viral shedding whilst asymptomatic or with mild symptoms (as described by UK Chief Medical Officer on 13 March) is probably a major cause of this problem.
See how the next two charts level out:
China outside of Hubei - they have probably done best in stopping the epidemic so far - but persistent rate of change in cases exists around +0.1%, even with fairly strict limits to social interaction:

China outside of Hubei - very similar plot, this time of actual new daily cases, stuck between single figures and about 25/day, averaging 10 or so:

Compare the above two to Singapore below ("pre-epidemic"). Singapore is a poster child for success so far - but it is starting to break away into a mild acceleration. Note how similar the clusters are to the two charts above. Here is Singapore new daily case. Note small initial clusters of increasing size, then a lull, then new clusters that are slightly larger (only small right now but persistent at around 10 new cases/day):

This is enough to cause some acceleration in Singapore chart and a vaguely parabolic trend, far slower than the exponential trend seen in many other countries:

Also, the % day over day change in Singapore is increasing slightly after a lull. The left hand spike at +75% can be ignored and was caused by the cases going from 4 up to 7. Remember those single digits? Note that spike on the right up to a point at 10%/day. Signs of a small breakout or at least of persistent case clusters at around 10 new cases per day on a total approaching 200 i.e. 5%/day on average for last few days:

Comments
Post a Comment