Has Italy turned the corner in its COVID-19 fight?
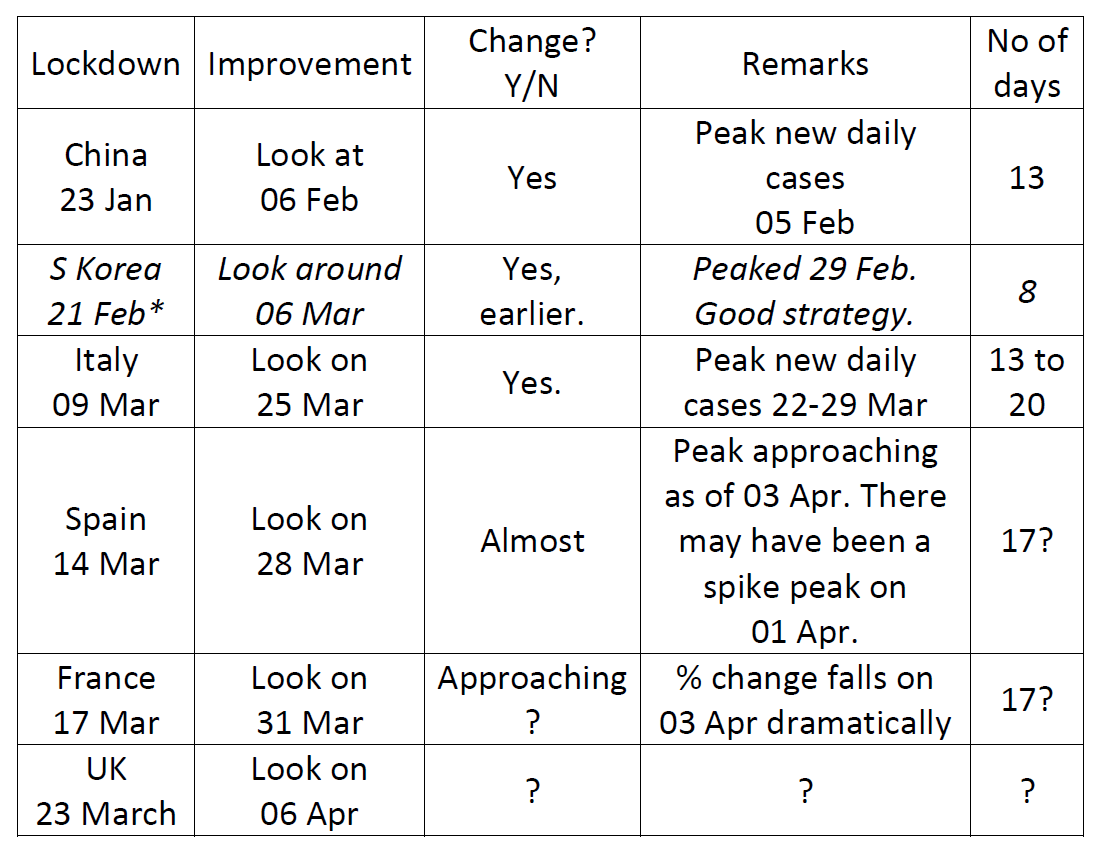
Over recent weeks I had some charts out indicating that a peak in Italy's new COVID-19 cases was coming soon. I had dates between 31 March and 05 April. The earlier dates were associated with better, lower total figures because the curve would have been higher if it was longer. I had kind of settles on around 6400 cases on around 02 April but the recent days data from the WHO have shown that Italy's daily new cases have already declined for a few days now after a one day spike to 6,700 cases a few days ago. My original forecast was in blue. It took into account around the past 40 days of data. However, over recent days the % increase from day to day has down trended more rapidly. I think it could be the result of the very restrictive lock downs in Italy over recent weeks significantly slowing the spread of the disease, in which case it is valid to prefer the trend of the recent data to the entire data set.
This is no guarantee of a good outcome but I ran with that more recent trend and created the green curve below. The green curve is the optimistic one. It may be too optimistic. The blue curve is the original one, now the "pessimistic" curve.
Italy's pessimistic forecast is a total of 349,641 cases in line with previous forecasts.
Ital'y optimistic forecast which could be spoiled by one bad point is for 173,026 cases in total.
I think the end result will almost definitely be between these two, let's hope closer to the 173,026 figure.
Italy's case in WHO report #71 on 31 March were 101,739. When the peak new cases was reached with CHina and SOuth Korea, it marked around the half way point in the total, so it might be fair as a rule of thumb to expect something like 200,000 total confirmed cases for Italy (on current testing standards). Five days ago,m the total case load was 74,836 and that is where the green curve peaks, so a total under 200,000 is certainly possible!
The total numbers of cases will actually be the areas under the curves below.
Warning to UK. It is likely to be much higher figures and a much larger and more painful curve. I present pessimistic and optimistic curves for daily new cases of UK compared with the original forecasts taken from the largest data sets possible for Italy, France and Spain. Let this be a sever warning to complacent policymakers. Total UK cases confirmed on current trend and current testing standards could be 1-4 million if things do not improve. Note the extremely high new cases per day on the two large UK curves below. Neil Ferguson said that (one of) the parameters for the UK was improving. Barely. I think he meant that the daily % change in cumulative cases was falling (very, very slowly). This means a prolonged and huge curve. In my view, it was a dangerously complacent statement and a kick in the teeth to the NHS people who are being given false hopes by him, Also, it is not helpful in terms of bracing the public and encouraging them to do what is needed: stay home!


Comments
Post a Comment