My UK forecast is turning out wrong thank God - or is it?
My UK forecast is turning out wrong, thank God.
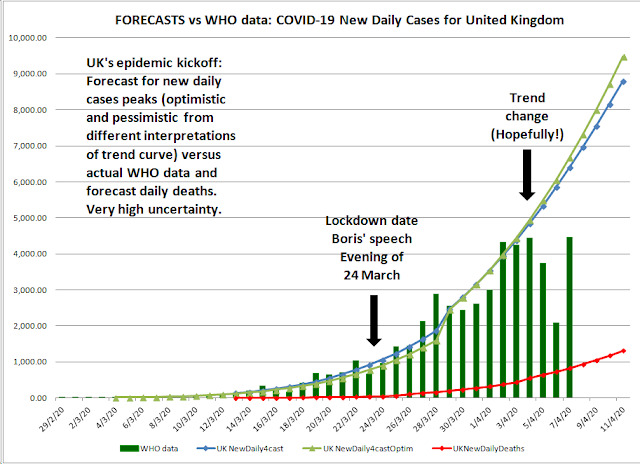
The UK was on a trajectory to disaster until two days ago, 04 April. Our performance was worse than Italy, France and Spain at similar times.
In view of what happened in Italy, I looked at the leak new cases, which came at the same level (about 4 days at ~5900-6,500 in a single day) but a little earlier than I had forecast weeks ago. This encouraged me to look for a more optimistic trend for Italy. I noticed that the peak of new cases had first occurred (the actual highest day) about 13 days after the full lockdown of the country on 9th March, bearing in mine that there was already a lockdown of some limited regions in the north and then of the entire Milan area prior to 9th March.
So in the previous post, I explored whether the cases peaking seems to be related to the start of the full lockdown measures and it seems that for Spain and probably France too, there is a period of about two weeks. This also happened in China but the epidemic was much quicker in China. South Korea has a period of 9 days from their immense case testing and isolation efforts to their peak in new cases.
However, two weeks seems to be the standard so I was looking for UK to improve perhaps by 6th April. However, we have an interim peak in new daily cases as of 5th April. So this has "flattened the curve" or more accurately, cut short the curve hopefully. You can see with Italy that the peak in new cases was already predictable from the trend line of the previous 30 days but the right hand side of the curve has been cut off - or partially cut off by the lockdown., So for Italy I now have a minimum and maximum forecast around 170,000 and 250,000 confirmed cases, along with 30,000 deaths, tragically.
Let's wait and see if the improvement in UK cases is real or is just from lack of testing or some other anomaly. It's odd for the deaths to decline on the same day as the cases:


Since the epidemic in China followed a consistent trend even from the day of the lockdown of Wuhan, I am wondering if the peak in new cases is already baked in to the trend and is intrinsic to the infectiousness of the disease. In actual fact, the slope of the trend followed an exponential decay equation all the way through and was consistent (in China and South Korea). Here is the China curve for cases and deaths that was followed very closely the whole way through their main epidemic (Wuhan already locked down):

Here is Italy's curve:

However, the slightly slower and considerably larger epidemics in European countries (including the UK) seem to have a trend change sometime after the lock down is fully imposed, so it is necessary to re-calculate forecasts after the peak new cases is reached.
Italy, France and Spain have been fairly predictable, as paer China and South Korea but a little wider in forecast ranges:


Comments
Post a Comment