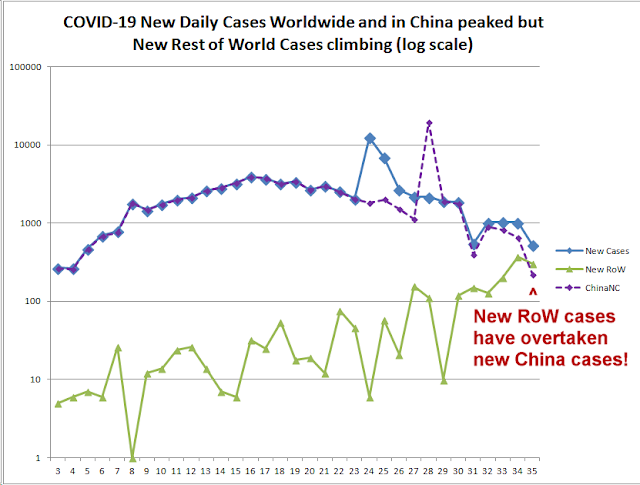
20200222 Rest of world new cases overtook China new cases today! Pandemic Smoking Gun Possibility 2.
Today, the daily increase in rest of world COVID-19 cases overtook China's new cases for the first time. Nothing else to say except for this.
The WHO still has China as Very High risk, and Regional risk as merely High and worldwide risk as High. They are not even acknowledging a regional pandemic with South Korea's cases doubling every 48 hours or less!
Here is the chart. This is comparing Worldwide daily new cases to China daily new cases (at the top and falling quite rapidly) with rest of world daily new cases (was at the bottom but now rising rapidly and overtaking China):
China situation has improved significantly and rest of world has deteriorated significantly. The daily new cases in the rest of the world are on a straight line trend on a log chart - as you can see! That means exponential rise!
One can see on the following chart the S-curve of China in green and the rest of the world starting to break away above it, perhaps in to another S-Curve hopefully not of fimilar magnitude. Current forecasts from me give China topping out at around 86,000 cases, down from the previous forecast of 98,000 after adding the past couple of days' data.
Rest of World new cases is on an exponential trend indicating pandemic underway (log graph). Remember that the WHO COVID-19 Situation Reports started at 282 cases on January 2020 worldwide (huge majority in China). Now we have 800+ in South Korea alone!
The normal linear chart shows the explosive rise (most from South Korea). Recall also that there is very limited information on the situations in Iran and N Korea at this time so these figures could be increasing more rapidly:


Comments
Post a Comment