Posts

14 April 2020 New forecasts for Italy

Image
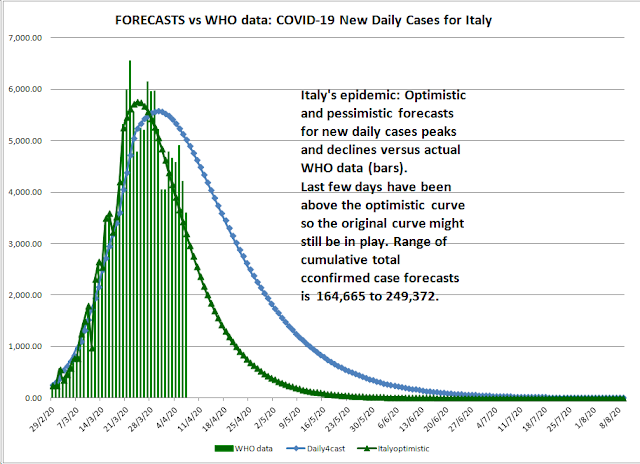
14 April 2020 New forecasts for Italy based on different interpretations of the actual daily WHO data trends: Italy pessimistic cases 233,208 Italy optimistic cases 212,271 Italy log cases 242,202 Italy deaths  pessimistic  29,209 Italy deaths  optimistic  27,275 The pessimistic and optimistic lines are converging as might be expected as the forecasts become less volatile as new data points are added to the various trend lines.
Estimates of ICU / Critical Care Bed Usage in UK

Image
Estimates of ICU / Critical Care Bed Usage in UK, updated 08 April, plus forecast curves:

UK forecasts as of 10 April STILL BAD.

Image
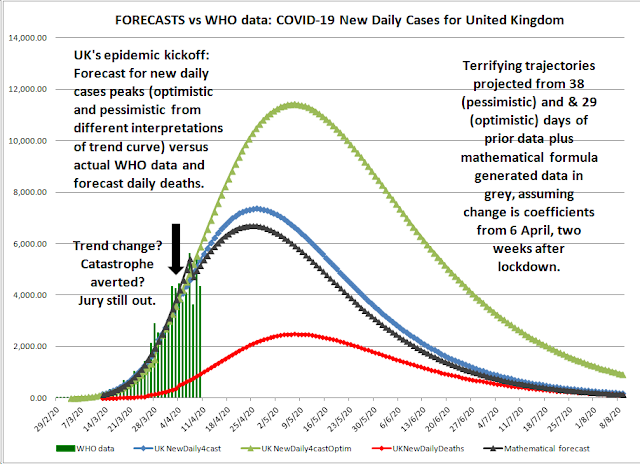
UK forecasts as of 10 April total cases: 853,751 (pessimistic from WHO data) 452,856 (optimistic from WHO data), 412,913 (mathematical model). Deaths: 161,838 (from WHO data). The UK forecasts are shrinking but I don't fully trist this shrinkage of the numbers right now. I have seen this kind of volatility in the forecasts before and they often go too optimistic for a while. You need to take some kind of average over time. Anyway, here is the chart:

COVID-19 exit strategy 2 years alternating lockdown and release

Image
COVID-19 exit strategy 2 years alternating lockdown and release Here is the Imperial College research link and also an interview with another researcher. https://www.youtube.com/watch?v=R1wkV2IzR_U I wrote in a comment that Professor Gunther Shonrich is saying that herd immunity is basically inevitable so good luck. I think it probably is because the thing is so contagious. We are all going to have to take our chance with it, especially next winter. He is talking about things like the Imperial College study pages 10 & 12, note the 2/3 lockdown, 1/3 release diagram on p12:  https://www.imperial.ac.uk/media/imperial-college/medicine/sph/ide/gida-fellowships/Imperial-College-COVID19-NPI-modelling-16-03-2020.pdf The study has these figures. A picture paints 1000 words. They are in reverse order from that shown iin tht eoriginal paper: Alternating lockdowns and not-lockdowns until end of 2021 possible: How the epidemic curves are modified by some interventions but yo...

Italy and UK case and death forecasts 20200408

Image
Italy and UK case and death forecasts 20200408: Charts:

Spain. Italy, France and the UK. Warning for UK to improve or cost will be high.

Image
Here are the curves for Italy, Spain and France. Italy peaked a little while ago, Spain next and possibly France after that, though their numbers are a bit more volatile from day to day: Current forecasts for Italy:  Cumulative cases: 164,665 to 239,162. Cumulative deaths: 30,364-32,954 I am very pleased with my forecasting tools especially in terms of their ability to calculate the peak numbers of new daily cases quite accurately in advance. One has to be a little bit careful to change the start points of forecasts in line with the new data and choose a point that is on the forecast equation line each time it is done, so it not an "automatic" process. Explanations on charts: Italy: Italy deaths: Spain: Forecast of total cumulative cases: 338,614 or perhaps fewer because I have not yet constructed an "optimistic" forecast as I did for Italy. I don't have the time time or resources to do everything! France trend has improved and the tot...

ICU/CC Intensive care critical bed usage in the UK forecast and ICNARC data

Image
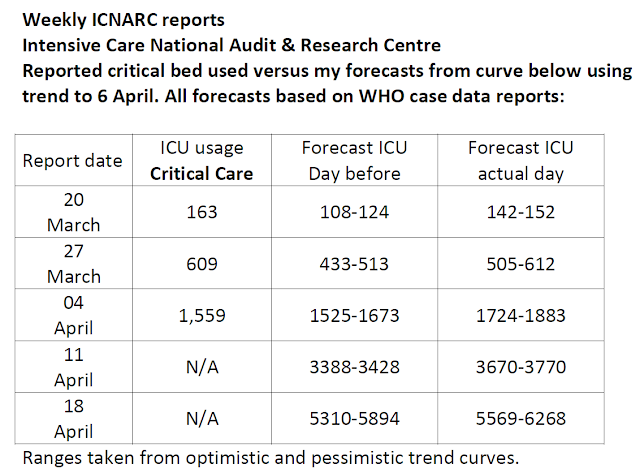
ICU/CC Intensive care critical bed usage in the UK Weekly ICNARC reports Intensive Care National Audit & Research Centre Reported critical bed used versus my forecasts from curve below using trend to 6 April. All forecasts based on WHO case data reports 53-78: This is the forecast curve (most optimistic, given WHO reports 53-78): (c) D. Bellamy 2020. Revision late night 08 April 2020 from forecast curves (range between optimistic and pessimistic forecast curves): 19&20 March ranges   108-124 and 142-152  26&27 March ranges   433-513  and 505-612 03&04 April ranges   1525-1673  and  1724 -1883 10&11 April ranges   3388-3428 and  3670-3770 17&18 April ranges   5310-5894 and 5569-6268. My curves have risen a little more steeply than the actual figures, so far - but it is early in the trend and forecasts are realistic compared to actual numbers from ICNARC.